KNEE LIGAMENTOUS LAXITY ASSESSMENT/TEST
Motorized tibial rotation test for knee ligamentous structures assessment - ROTAM
Genourob's last innovation in the field of knee structures analysis is the ROTAM. It is the first motorized medical device dedicated to inducing controlled tibial rotation. This arthrometer (aka. laximeter) has quickly become the reference in the orthopaedic field for studying the state and performance of the knee peripheral ligamentous structures by applying a motorized tibial rotation.
ROTAM video - Knee peripheral ligamentous structures assessment
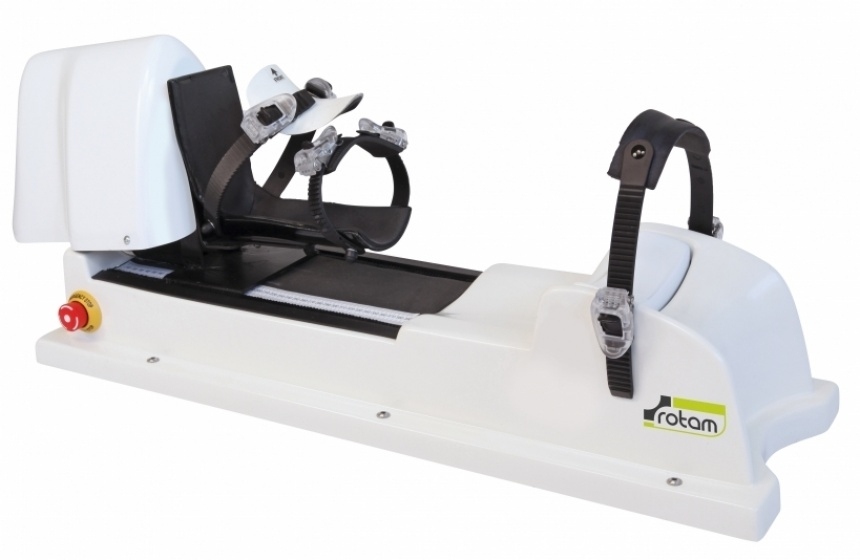
ROTAM - Motorized tibial rotation for peripheral ligamentous structures assessment
The ROTAM is currently the device that provides the best precision and it is the only arthrometer (aka. laximeter) able to objectively evaluate tibial rotation ultimately giving information on the state of the knee peripheral ligamentous structures. Tests that are done by the ROTAM are dynamic and user friendliness has been considered while the designing of this medical device. Several parameters and sensors are indeed incorporated in this arthrometer to help the users in running their tests. Precise test reproducibility has therefore also become an attribute of the ROTAM because of these sensors and parameters.
The LDA® Method is an integral part of the ROTAM and it is perhaps what makes the ROTAM leader on the market for peripheral knee ligamentous structures analysis. The results provided after running tests are shown under the form of a graph with curves accompanied by a table chart. This makes the tests easy to understand, to reproduce and it allows an evaluation with accurate figures of knee laxity and more precisely knee stability.
Example of a test on the knee peripheral ligamentous structures using the ROTAM
Graph 1
Graph 1 shows the curve results with its table chart obtained after performing tests on both knees of a same patient with the ROTAM. The graph shows the curves obtained after applying several torques on the tibia of the patient to perform a motorized tibial rotation.
This is called a dynamic analysis because calculation of the degree of rotation of the tibia is done while applying different forces which put the knee peripheral ligamentous structures under stress. Therefore, the bigger the rotation degree differential, the higher the chances are that knee peripheral structures have been injured.
For example, in graph 1 we see three medial rotation curves with three different colors:
- Green: Healthy knee
- Red: Pathological Knee
- Blue: Operated Knee
We can see that the green curve (healthy knee) shows much less rotation than the red curve (pathological knee). This indicates that the knee peripheral structures have been injured and therefore anterior-external surgery is necessary. Blue curve shows the results after surgery was performed.
So far, there is no other arthrometer in the field of orthopaedic medical devices that allows such a precise reproducible method for analysing these structures in the knee.
Click on the title below to learn more about dynamic assessment of the knee ligamentous structures.
Innovation: Analysing the slopes of the laximetry curves.
Graph Results of two patients
The graphs above show the ROTAM's precision concerning the functional analysis of the knee peripheral ligamentous structures. The tests shown above are dynamic. They indeed show different torques applied on the tibia associated with different tibial rotation and this has proven to be effective in the study of Mouton in 2015.
The ROTAM allows to objectively evaluate the rotational laxities by measuring rotation differentials and slope diferentials between both of the patients' knees.
Both graphs shown above show a comparison of two patients' results.
| Patient 1: No instability in both knees | Patient 2: Instability in left knee |
|
|
The table chart above resumes the analysis done between on Patient 1 and 2: The difference resides in the fact that the slope of the curves do not behave alike for both patients and there is also an acute rotation differential.
This example purely states the efficiency of running dynamics tests against static tests on the knee. Considering the slope differential between both curves on behalf of the rotation differential is a precise technique to a precise analysis of the state and performance of the knee peripheral ligamentous structures.
The ROTAM is therefore nowadays the best arthrometer for evaluating the state of the knee peripheral ligamentous structures following knee injuries before surgery. Besides, it is also very useful after knee surgery as is allows the doctors to follow the state of the knee structures over time. Following anterior cruciate ligament surgery, anterior-external surgery is sometimes needed and patient need a lot of time to recover, therefore the ROTAM is also useful during knee rehabilitation as precise follow-up is available.
How to run tests on the knee ligamentous structures using the ROTAM
ROTAM - Patient Positioning Tutorial
To run a precise diagnosis on the knee peripheral ligamentous structures of a patient using Genourob's ROTAM, it is required to follow these steps:
1) Position the patient on the ROTAM.
2) Run the tests on both legs.
3) Read the results on the graph and its table chart.
1) Position the patient on the ROTAM
Likewise to most of our products, patient positioning is the first step to run tests on the knee peripheral ligamentous structures of the patient. His leg should be in a 45° flexion for optimal testing. This can easily be done with a LDA® Couch which is an accessory especially designed for our products and patient comfort.
Once correct patient positioning is achieved, the first step to run successful tests on the knee peripheral ligamentous structures is to draw a mark with a pencil on the apex of the patella. The leg of the patient shall then be placed on the ROTAM with the mark of the apex of the patella being located in the hole of the knee cup. The objective here is to block the patella against the femur so that when tests are start, the femur/patella stay locked in position while the tibia undergoes internal/external (medial/lateral) Rotation. Following this, the foot is to be locked in the ROTAM's boot.
2) Run the tests
Once patient positioning is achieved, a patient file is to be created on the computer that is provided with the ROTAM and the tests shall begin. As soon as a torque force is chosen (3, 5, 8 N.m...), the user can choose to run the tests:
The boot located at the lower extremity of the ROTAM starts applying the torque chosen by the user on the tibia leading to a rotation. When the chosen force is detected, the rotation stops and goes back to its initial position. This ultimately makes the sensor in the boot turn forth/backwards calculating the rotation of the tibia compared to the force applied. The data collected is then stored in a table chart with a graph.
Repeat this on the other knee.
3) Results:
When the tests are done, the user will find in the results tab the data collected from these tests. They are under the form of a graph showing the compliance curves (=opposite of the stiffness curves) accompanied by a table chart showing the numerical values.
ROTAM main characteristics for optimal knee ligamentous structures examination
- Device using LDA® Method applying motorized tibial rotation for knee peripheral ligamentous structures analysis and knee stability objective evaluation
- Dynamic and none-invasive tests
- Automated tibial rotation differential and curves slope differential calculation
- Registration of the patellar fixation force and patient foot / Base of the machine distance for reproducibility
- Delivery with PC and LDA® Software
- Thrust force from 1 to 200 N
- Patient data automatically saved, results exportable as xls. files, pdf. format for great communication
- Dimensions : 845 x 270 x 400mm / 15kg
ROTAM additionnal options
- LDA®Couch which provides the patient with great comfort and is specially designed for the patient positioning when running tests with the ROTAM.
- Biofeedback option that allows controlling of the hamstring muscular activity.
- LDA®Trolley for PC use comfort and storage of the printer for printing the results.